Berkas:Number of prokaryotic genomes and sequencing costs.svg

Ukuran pratayang PNG ini dari berkas SVG ini: 800 × 533 piksel Resolusi lainnya: 320 × 213 piksel | 640 × 427 piksel | 1.024 × 683 piksel | 1.280 × 853 piksel | 2.560 × 1.707 piksel | 1.350 × 900 piksel.
Ukuran asli (Berkas SVG, secara nominal 1.350 × 900 piksel, besar berkas: 145 KB)
Ringkasan
| Deskripsi |
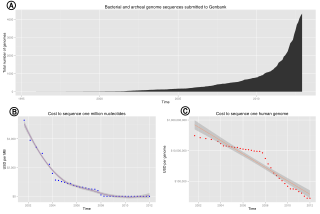
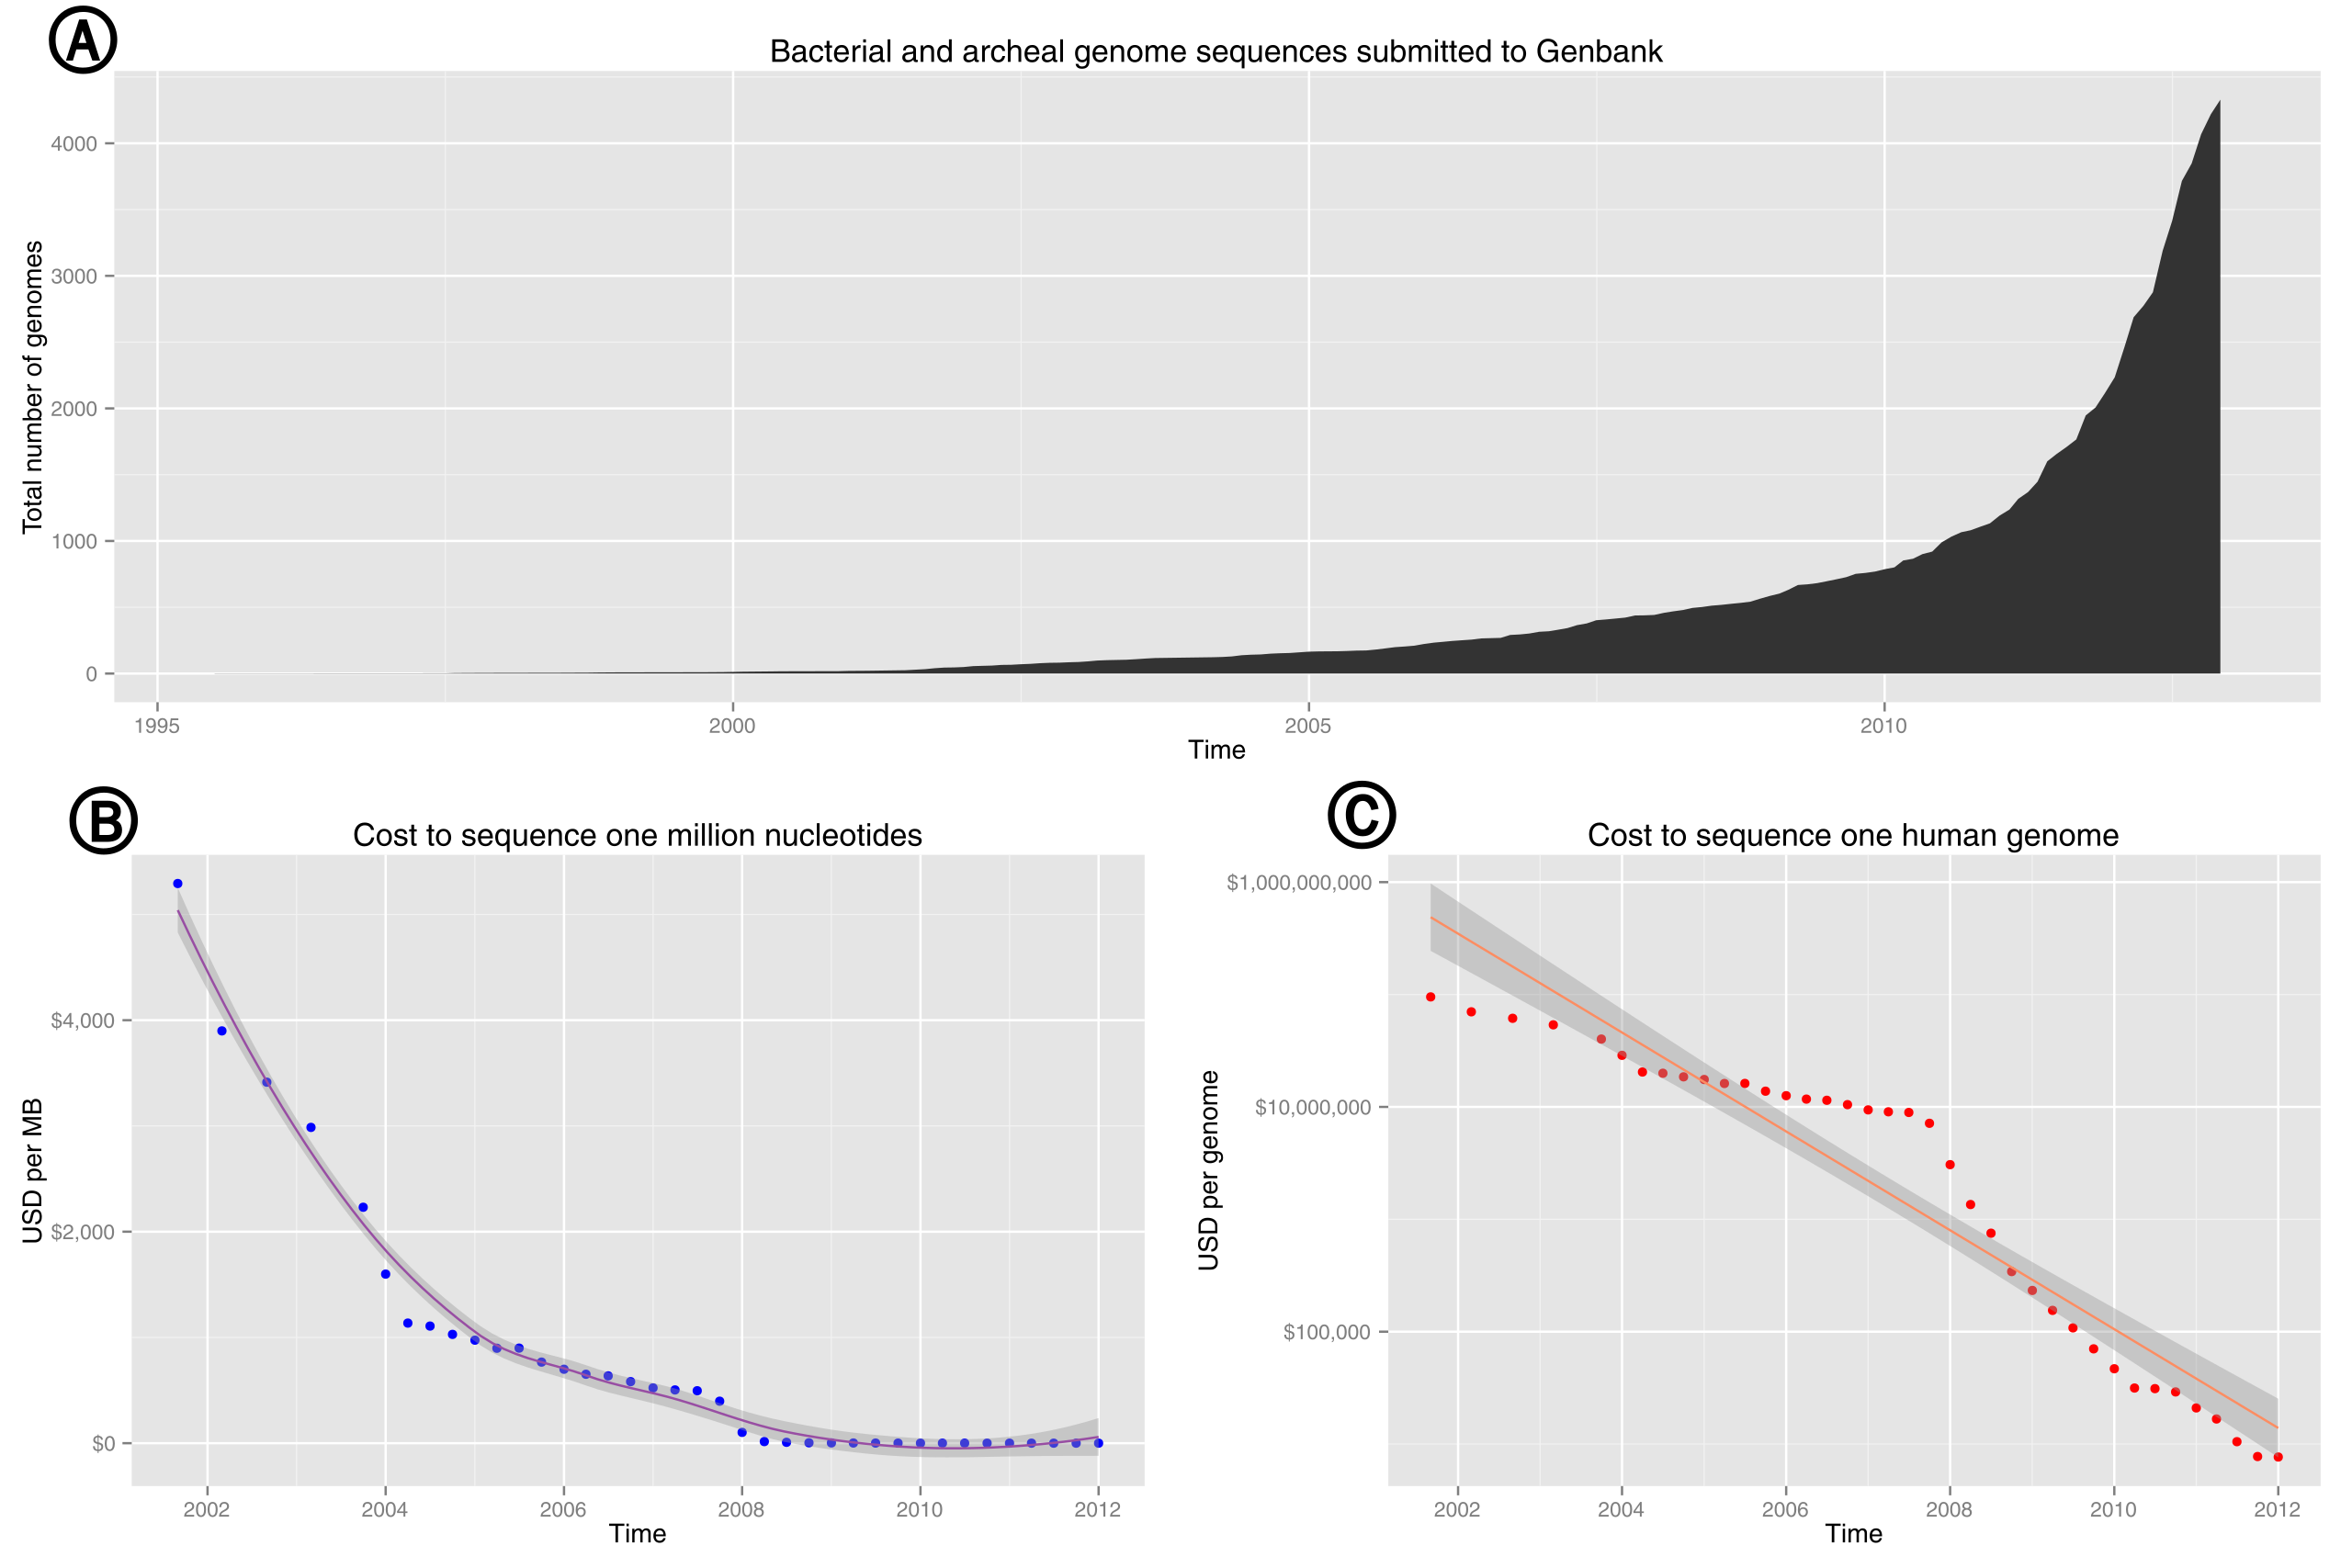
English: Plot of the total number of prokaryotic genomes submitted to Genbank as a function of time. Based on data from genome reports and genome.gov. Subfigures: (A) Exponential growth of genome sequence databases since 1995. (B) The cost in US Dollars (USD) to sequence one million bases. (C) The cost in USD to sequence a 3,000 Mb (human-sized) genome on a log10 transformed scale. |
| Tanggal | |
| Sumber | Karya sendiri |
| Pembuat | Estevezj |
| Versi lainnya |
This file was derived from: Bacterial and archeal genome sequences submitted to Genbank.svg: |
| SVG genesis | Gambar vektor ini dibuat menggunakan R This file uses embedded text that can be easily translated using a text editor. |
| Kode sumber | R code# Download our tables from NCBI's FTP site. Accessed 14:30PST, 18 December 2012
prok <- read.table("ftp://ftp.ncbi.nlm.nih.gov/genomes/GENOME_REPORTS/prokaryotes.txt", sep="\t", comment.char="!", header=T)
# Pull release dates, while dropping rows lacking a release date.
prok <- as.Date(prok$Release.Date[prok$Release.Date != '-'],format="%Y/%m/%d")
# Bin our dates by month and year, tabulate, and save to a dataframe.
prok.cut <- as.data.frame(
table(
as.Date(
cut(prok, "month")
)
)
)
# Correct our column titles, calculate a running total, and reconvert from factor to date
colnames(prok.cut) <- c("Date", "Total")
prok.cut$Total <- cumsum(prok.cut$Total)
prok.cut$Date <- as.Date(prok.cut$Date)
# DNA Sequencing Costs from NHGRI: http://www.genome.gov/sequencingcosts/
# Data from http://www.genome.gov/pages/der/sequencing_cost.pptx
# After munging the pptx, download the tables from pastebin. Accessed 12:42PST, 2012-12-20
seq.cost <- read.table("http://pastebin.com/raw.php?i=NA6c4i70", header=TRUE)
# Format the date.
seq.cost$Date <- as.Date(seq.cost$Date,format="%m-%d-%Y")
# Draw our plots
library("ggplot2")
library("grid")
library("scales")
(p <- ggplot(prok.cut, aes(Date, Total)) + geom_area() + ggtitle("Bacterial and archeal genome sequences submitted to Genbank") + xlab('Time') + ylab("Total number of genomes")
)
(mb <- ggplot(seq.cost, aes(Date, USD.per.Mb)) + geom_point(colour = "blue") +
stat_smooth(color="#984EA3")+
ggtitle("Cost to sequence one million nucleotides") +
xlab('Time') +
ylab("USD per MB") +
scale_y_continuous(labels = dollar)
)
(genome <- ggplot(seq.cost, aes(Date, USD.per.Genome)) + geom_point(colour = "red") +
stat_smooth(method='lm',color="#FC8D62")+
ggtitle("Cost to sequence one human genome") +
xlab('Time') +
ylab("USD per genome") +
scale_y_log10(labels = dollar)
)
# This part is based on Hadley's Ggplot2 book (doi:10.1007/978-0-387-98141-3_8)
# Save our plot to SVG
library(grDevices)
svg(filename='ncbi-genomes.svg', width = 15, height = 10)
grid.newpage()
pushViewport(viewport(layout = grid.layout(2, 2)))
vplayout <- function(x, y)
viewport(layout.pos.row = x, layout.pos.col = y)
print(p, vp = vplayout(1, 1:2))
print(mb, vp = vplayout(2, 1))
print(genome, vp = vplayout(2, 2))
dev.off()
|
Lisensi
Saya, pemilik hak cipta dari karya ini, dengan ini menerbitkan berkas ini di bawah ketentuan berikut:
Berkas on ipartandoan sian on Creative Commons Attribution-Share Alike 3.0 Unported partadoan.
- Anda diizinkan:
- untuk berbagi – untuk menyalin, mendistribusikan dan memindahkan karya ini
- untuk menggubah – untuk mengadaptasi karya ini
- Berdasarkan ketentuan berikut:
- atribusi – Anda harus mencantumkan atribusi yang sesuai, memberikan pranala ke lisensi, dan memberi tahu bila ada perubahan. Anda dapat melakukannya melalui cara yang Anda inginkan, namun tidak menyatakan bahwa pemberi lisensi mendukung Anda atau penggunaan Anda.
- berbagi serupa – Apabila Anda menggubah, mengubah, atau membuat turunan dari materi ini, Anda harus menyebarluaskan kontribusi Anda di bawah lisensi yang sama seperti lisensi pada materi asli.

|
Diizinkan untuk menyalin, mendistribusikan dan/atau memodifikasi dokumen ini di bawah syarat-syarat Lisensi Dokumentasi Bebas GNU, Versi 1.2 atau lebih baru yang diterbitkan oleh Free Software Foundation; tanpa Bagian Invarian, tanpa Teks Sampul Depan, dan tanpa Teks Sampul Belakang. Salinan lisensi dimasukkan ke bagian yang berjudul Lisensi Dokumentasi Bebas GNU. |
Anda dapat memilih lisensi pilihan Anda.
Riwayat berkas
Klik pada tanggal/waktu untuk melihat berkas ini pada saat tersebut.
| Tanggal/Waktu | Miniatur | Dimensi | Pengguna | Komentar | |
|---|---|---|---|---|---|
| terkini | 21 Desember 2012 05.04 | | 1.350 × 900 (145 KB) | Estevezj | Added subplot labels. |
| 21 Desember 2012 04.50 |  | 1.350 × 900 (107 KB) | Estevezj | {{Information |Description ={{en|1=Plot of the total number of prokaryotic genomes submitted to Genbank as a function of time. Based on data from [http://www.ncbi.nlm.nih.gov/genome genome reports] and [http://www.genome.gov/sequencingcosts/ genome.... |
Penggunaan berkas
Halaman berikut menggunakan berkas ini:
Penggunaan berkas global
Wiki lain berikut menggunakan berkas ini:
- Penggunaan pada bs.wikipedia.org
- Penggunaan pada en.wikipedia.org
- Penggunaan pada mk.wikipedia.org
- Penggunaan pada sr.wikipedia.org