Berkas:Global monthly temperature record.png
Ukuran asli (1.065 × 640 piksel, ukuran berkas: 130 KB, tipe MIME: image/png)
Ringkasan
| Deskripsi |
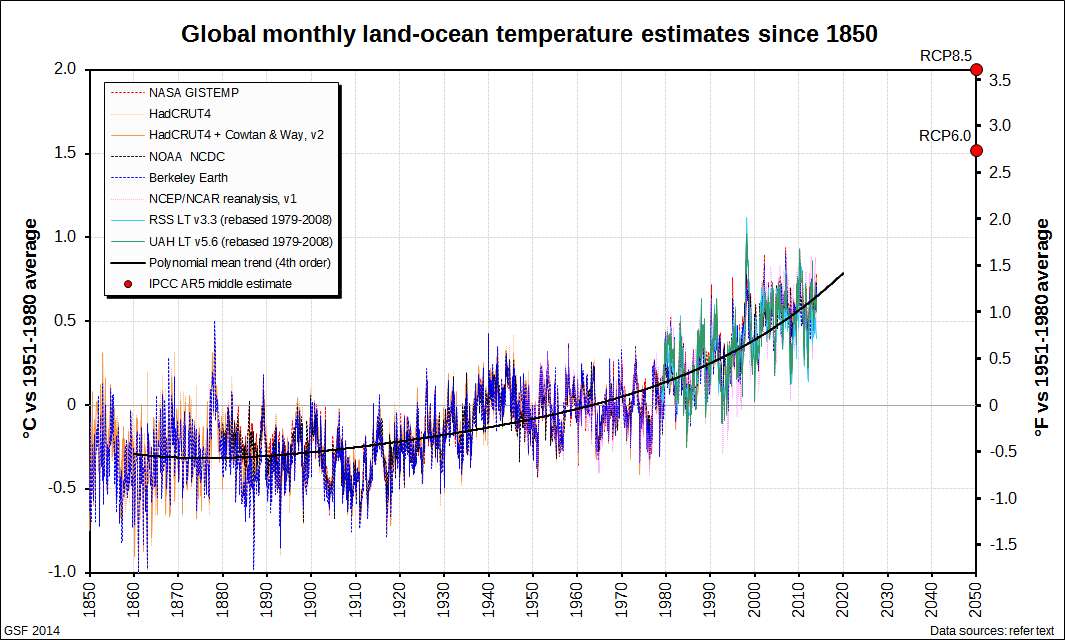
Bahasa Indonesia: Perkiraan suhu bulanan dunia (darat dan laut) dari delapan sumber berbeda |
| Tanggal | |
| Sumber | Karya sendiri |
| Pembuat | Glen Fergus |
Lisensi
- Anda diizinkan:
- untuk berbagi – untuk menyalin, mendistribusikan dan memindahkan karya ini
- untuk menggubah – untuk mengadaptasi karya ini
- Berdasarkan ketentuan berikut:
- atribusi – Anda harus mencantumkan atribusi yang sesuai, memberikan pranala ke lisensi, dan memberi tahu bila ada perubahan. Anda dapat melakukannya melalui cara yang Anda inginkan, namun tidak menyatakan bahwa pemberi lisensi mendukung Anda atau penggunaan Anda.
Ringkasan
The graph shows global monthly near-surface air temperature anomaly estimates since 1850 from eight sources spanning three different estimation approaches. The plotted values are temperature anomalies — the difference between a month’s temperature from a given series and the mean for that month of the year for that series across a reference interval, here taken as 1951 – 1980. The overlaid trend is a 4th order polynomial fit to the mean of the plotted series.
Data sources
Instrumental estimates
1. NASA GISTEMP global temperature series[1]
2. HadCRUT4 global temperature series[2]
3. HadCRUT + Cowtan & Way global temperature series (version 2)[3]
4. NOAA National Climate Data Center global temperature series[4]
5. Berkeley Earth land + ocean global temperature series[5]
Reanalysis estimates
6. NCEP / NCAR reanalysis (version 1) global average surface air temperatures[6][7]
Satellite estimates
Satellite MSU remote sensing cannot measure meteorological surface air temperature (typically defined as that at 2 m height). The best that can be obtained is a temperature estimate across the lower troposphere,[8] about the bottom 5000 m of atmosphere[8] That temperature is of course much colder than the surface temperature and varies somewhat differently with climatic influences. Nevertheless it is often compared with surface temperatures.[9] The satellite series do not extend across the reference interval adopted for the graph. Instead they are each rebased so that their mean across the 30 year interval 1979 – 2008 equals the mean of the five instrumental series across the same interval.
7. RSS temperature lower troposphere global temperature series (RSS TLT version 3.3)[10]
8. UAH temperature lower troposphere global temperature series (UAH TLT version 5.6)[11]
Future predictions
For comparison, the Intergovernmental Panel on Climate Change Fifth Assessment Report[12] central temperature estimates for 2050 for representative concentration pathways RCP6 (mid range) and RCP8.5 (high) are also shown.
Open source
The Microsoft Excel spreadsheet that produced this graph can be downloaded here: http://gergs.net/?attachment_id=1246.
References
- ↑ NASA GISS Surface Temperature Analysis. Goddard Institute for Space Studies.
- ↑ Met Office Hadley Centre observations datasets HadCRUT4. UK Met Office.
- ↑ Cowtan, K., & Way, R. G. (2013). Coverage bias in the HadCRUT4 temperature series and its impact on recent temperature trends. Quarterly Journal of the Royal Meteorological Society
- ↑ Global Surface Temperature Anomalies. National Climatic Data Center. Retrieved on 2010-06-16.
- ↑ Berkeley Earth Land + Ocean Data. Berkeley Earth.
- ↑ Kalnay et al.,The NCEP/NCAR 40-year reanalysis project, Bulletin of the American Meteorological Society, 77, 437-470, 1996
- ↑ NCEP/NCAR Reanalysis Monthly Means and Other Derived Variables. Earth Systems Research Laboratory.
- ↑ a b Upper Air Temperature. Remote Sensing Systems..
- ↑ For example File:Satellite Temperatures.png
- ↑ MSU & AMSU Time Series Trend Browse Tool. Remote Sensing Systems.
- ↑ UAH MSU Data.
- ↑ Climate Change 2013, The Physical Science Basis. Retrieved on 2013-05-03.
Also see


Riwayat berkas
Klik pada tanggal/waktu untuk melihat berkas ini pada saat tersebut.
| Tanggal/Waktu | Miniatur | Dimensi | Pengguna | Komentar | |
|---|---|---|---|---|---|
| terkini | 3 Mei 2014 11.49 | | 1.065 × 640 (130 KB) | Gergyl | RCP6.0 rather than RCP4.5 |
| 28 April 2014 02.01 |  | 1.065 × 640 (130 KB) | Gergyl | Rev 7, align labels | |
| 28 April 2014 01.38 |  | 1.065 × 640 (130 KB) | Gergyl | + Berkeley Earth, IPCC AR5; font to liberation sans, for svg | |
| 16 November 2013 23.21 |  | 1.064 × 639 (150 KB) | Gergyl | Rev 5 | |
| 4 Mei 2011 08.10 |  | 1.066 × 619 (89 KB) | Glen Fergus | Update | |
| 14 September 2010 05.26 |  | 1.066 × 619 (88 KB) | Glen Fergus | Update; add NCEP/NCAR reanalysis. | |
| 15 April 2010 07.38 |  | 976 × 580 (80 KB) | Glen Fergus | {{Information |Description={{en|1=Global monthly land-ocean temperature estimates from five different sources.}} |Source={{own}} |Author=Glen Fergus |Date=2010-04-15 |Permission= |other_versions= }} |
Penggunaan berkas
Tidak ada halaman yang menggunakan berkas ini.
Penggunaan berkas global
Wiki lain berikut menggunakan berkas ini:
- Penggunaan pada en.wikipedia.org