Berkas:RiemannCriticalLine.svg

Ukuran pratayang PNG ini dari berkas SVG ini: 800 × 372 piksel Resolusi lainnya: 320 × 149 piksel | 640 × 298 piksel | 1.024 × 476 piksel | 1.280 × 595 piksel | 2.560 × 1.191 piksel | 933 × 434 piksel.
Ukuran asli (Berkas SVG, secara nominal 933 × 434 piksel, besar berkas: 50 KB)
W3C-validity not checked.
Ringkasan
| Deskripsi |
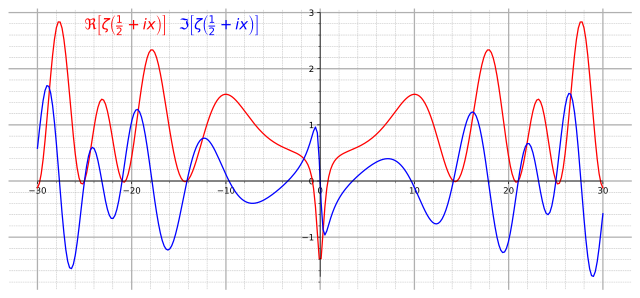
English: Graph of real (red) and imaginary (blue) parts of the critical line Re(z)=1/2 of the Riemann zeta function. |
||
| Tanggal | |||
| Sumber |
Own work. Made with Mathematica using the following code: Show[Plot[{Re[Zeta[1/2+I x]], Im[Zeta[1/2+I x]]}, {x,-30, 30},AxesLabel->{"x"} , PlotStyle->{Red, Blue}, Ticks->{Table[4x-28,{x,0,14}]}, ImageSize->{800,600}],
Graphics[Text[Style[\[DoubleStruckCapitalR][\[Zeta][ I x + "1/2"]],14,Red ,Background ->White],{-22,2.6} ]],
Graphics[Text[Style[\[GothicCapitalI][\[Zeta][ I x + "1/2"]],14,Blue ,Background ->White],{-14,2.6} ]]] |
||
| Pembuat | Slonzor | ||
| Izin (Menggunakan kembali berkas ini) |
Public Domain | ||
| SVG genesis | |||
| Kode sumber | Python code
|
Lisensi
| Saya, pemegang hak cipta karya ini, merilis karya ini ke domain umum. Lisensi ini berlaku di seluruh dunia. Di sejumlah negara, tindakan ini tidak memungkinkan secara sah; bila seperti itu: Saya memberikan siapa pun hak untuk menggunakan karya ini untuk tujuan apa pun, tanpa persyaratan apa pun, kecuali yang ditetapkan oleh hukum. |
Riwayat berkas
Klik pada tanggal/waktu untuk melihat berkas ini pada saat tersebut.
| Tanggal/Waktu | Miniatur | Dimensi | Pengguna | Komentar | |
|---|---|---|---|---|---|
| terkini | 23 Agustus 2017 20.01 | | 933 × 434 (50 KB) | Krishnavedala | much reduced vector version |
| 24 September 2009 22.28 |  | 800 × 600 (122 KB) | Geek3 | linewidth=1px | |
| 20 November 2008 19.33 |  | 800 × 600 (122 KB) | Slonzor | Man i've messed this up a lot of times. | |
| 20 November 2008 19.27 |  | 800 × 600 (3,36 MB) | Slonzor | ||
| 20 November 2008 19.23 |  | 800 × 600 (3,36 MB) | Slonzor | ||
| 20 November 2008 19.18 |  | 800 × 600 (3,36 MB) | Slonzor | ||
| 20 November 2008 19.13 |  | 800 × 600 (79 KB) | Slonzor | {{Information |Description={{en|1=Graph of real (red) and imaginary (blue) parts of the critical line Re(z)=1/2 of the Riemann zeta function.}} |Source=Own work. Made with Mathematica using the following code: <code><nowiki>Show[Plot[{Re[Zeta[1/2+I x]], |
Penggunaan berkas
3 halaman berikut menggunakan berkas ini:
Penggunaan berkas global
Wiki lain berikut menggunakan berkas ini:
- Penggunaan pada ar.wikipedia.org
- Penggunaan pada ba.wikipedia.org
- Penggunaan pada be.wikipedia.org
- Penggunaan pada ca.wikipedia.org
- Penggunaan pada ckb.wikipedia.org
- Penggunaan pada da.wikipedia.org
- Penggunaan pada el.wikipedia.org
- Penggunaan pada en.wikipedia.org
- Penggunaan pada eo.wikipedia.org
- Penggunaan pada eu.wikipedia.org
- Penggunaan pada fa.wikipedia.org
- Penggunaan pada fi.wikipedia.org
- Penggunaan pada he.wikipedia.org
- Penggunaan pada hi.wikipedia.org
- Penggunaan pada hy.wikipedia.org
- Penggunaan pada it.wikipedia.org
- Penggunaan pada it.wikiquote.org
- Penggunaan pada ja.wikipedia.org
- Penggunaan pada ko.wikipedia.org
- Penggunaan pada la.wikipedia.org
- Penggunaan pada mn.wikipedia.org
- Penggunaan pada nn.wikipedia.org
- Penggunaan pada no.wikipedia.org
- Penggunaan pada pa.wikipedia.org
- Penggunaan pada pt.wikipedia.org
- Penggunaan pada ru.wikipedia.org
- Penggunaan pada sl.wikipedia.org
- Penggunaan pada sq.wikipedia.org
- Penggunaan pada sr.wikipedia.org
- Penggunaan pada uk.wikipedia.org
- Penggunaan pada vi.wikipedia.org
- Penggunaan pada zh-yue.wikipedia.org
- Penggunaan pada zh.wikipedia.org